

These days, election coverage seems to operate under a shared, yet never-explicitly-stated understanding that a Democratic landslide is coming. Articles readily discuss Trump’s historic unpopularity, frustration over affordability and Iran, Latino desertion of the GOP, and various competitive red-state campaigns. However, the media appears reluctant to acknowledge the dying elephant in the room.
Personally, I suspect three main reasons for this:
1. Polls underestimated Republicans in 2016, 2020, and 2024, and the media fears a GOP firestorm if they underestimate them again.
2. Media coverage widely assumed a red wave throughout the previous midterm in 2022, for many similar reasons that one would expect a blue wave in 2026. Yet, the result was merely a red ripple.
3. Expert forecasters like the Cook Political Report have erroneously issued ratings that make it appear like the election is close. As of August 22, Cook’s House ratings have Democrats favored in 205 House seats versus 211 for the GOP.
Reason #3 is understandable from the perspective of the media, and the fault there lies entirely with forecasters. As I have previously written about, forecasters tend to lag far behind the data until roughly September, and their ratings do not accurately gauge the battlefield until then.
As for the other two, the fundamental issue is uncertainty about November. What if the data is “wrong” again? After the media debacle in elections like 2022, the caution is understandable.
Here’s the thing: we do, in fact, have strong predictors of the upcoming election. In fact, those predictors almost unanimously predicted the red ripple election in 2022. And those same predictors now fully unanimously forecast the same thing for 2026: an enormous blue wave, possibly the biggest since 2008, is crashing onshore.
THE GENERIC BALLOT
The easiest way to gauge the election is obvious: just ask the voters directly. Unsurprisingly, these “generic ballot” polls, where voters are asked if they’d vote for Democrats or Republicans, are quite predictive.
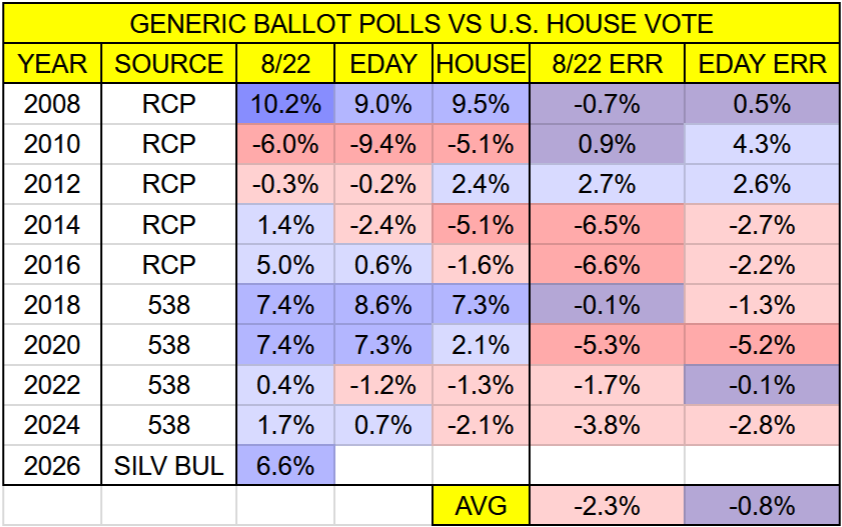
Note: The House vote is adjusted for uncontested elections, and mostly sourced from Split Ticket.
Since 2008, the election day average of generic ballot polls has been very accurate, only overestimating Democrats by an average of 0.8%, and coming within 3% of the actual House vote in 7 of 9 elections.
Notably, in 2022, generic ballot polls nailed the House vote at R+1. Unlike what the media may have believed, the generic ballot clearly forecasted a red ripple election. By contrast, the current generic ballot has Democrats leading Republicans by nearly 7%.
Historically, the generic ballot in August is a touch too blue and moves toward Republicans between now and election day. However, there’s good reason to believe this dynamic will reverse this year.
The main reason for this phenomenon is that polls early in the cycle mostly survey registered voters, while later polls mostly survey likely voters. Polls of registered voters underestimate the party with the more motivated and higher-turnout coalition — and historically, this was Republicans. However, polls this year consistently show Democrats doing better with likely voters. According to Silver Bulletin, if polls were all adjusted to be of likely voters, the generic ballot average would move from D+6.6 to D+8.1. This is supported by other factors later in the article, like special elections and primaries, where Democrats are turning out at much higher rates than Republicans.
The margin of error on polls is significant. If the generic ballot is D+8 on election day, the historic band of outcomes stretches from roughly D+3 to D+13, and is concentrated between D+5 and D+11. Even D+5 on the low end would be more than enough for Democrats to win the House and would probably get characterized as a wave, while D+11 would be a wipeout of epic proportions, on par with the landslide in 2008. And funny enough, this is among the less favorable predictors for Democrats, compared to what’s coming next.
PRIMARY TURNOUT
As of August 22, 46 of 50 states have held their main primaries, with the remaining being the blue states of DE, MA, NH, and RI. In the 35 states with sufficient partisan primary data, Democrats are projected to outvote Republicans by a whopping 12%-13% – the most heavily lopsided primary turnout in decades. And historically, the combined partisan turnout in these primaries has been extremely predictive of midterm general elections.
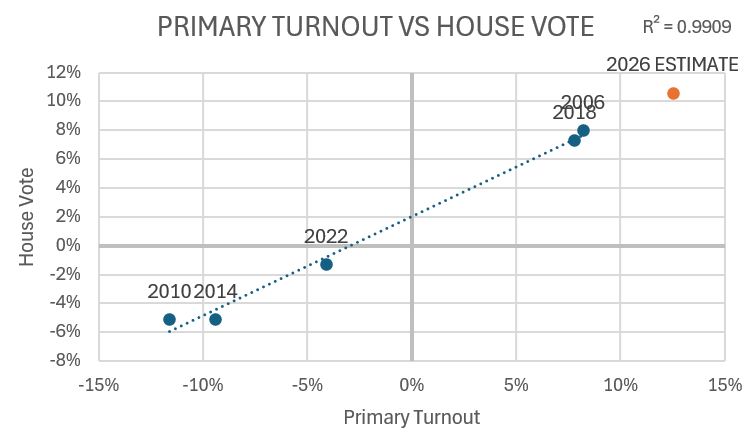
Using data from pollster John Couvillon, the relation between midterm primary turnout and the House vote is nearly one to one, with an R squared of 0.99. In 2022, Democratic resilience in primary turnout strongly indicated a red ripple midterm. However, applying this pattern to 2026’s D+12/13 primary turnout leads to an extraordinary conclusion: Democrats are projected to win the House vote by 10%-11%, a 2008-level landslide.
Notably, this is within the D+5 to D+11 band of outcomes generic ballot polls project, so this outcome is not an outlier. However, there exists other data that also corroborates such a landslide.
SPECIAL ELECTIONS
In 2017, it became clear a blue wave was forming when Democrats started regularly competing in deep-red special elections. Each congressional special became a media spectacle, and Democrats notably even notched a few wins, flipping Alabama’s Senate seat, as well as Trump+20 PA-18.
This cycle has been no different, with Democrats flipping 12 legislative seats from Republicans in special elections. From 2025-2026, Democrats have outrun Kamala Harris by 11.7% in special elections, implying a D+10 special election environment. Republicans have pointedly tried to avoid special elections for red seats, like Elise Stefanik’s NY-21, Neil Dunn’s FL-02, and Tony Gonzales’s TX-23, out of fear that they could flip.
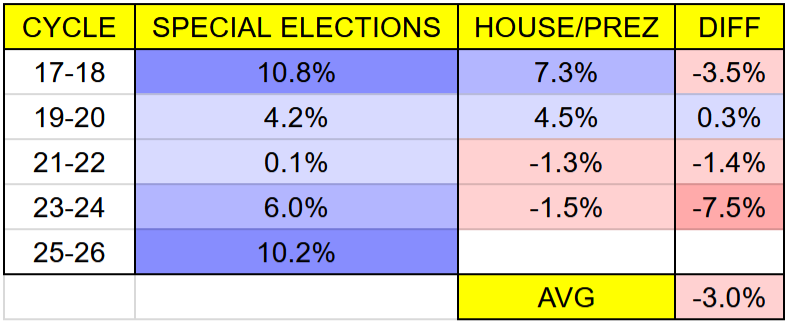
Looking through the data, special elections are typically predictive of the general election, although less so than primary turnout or generic ballot polls. In 2018, Democrats did a few points better in special elections than in the general. In 2020 and 2022, they were quite predictive, once again catching the red ripple election in 2022. In 2024 however, they were off by an unprecedented degree, as the high-propensity voters that turned out in special elections sharply diverged from everyone else.
Compositionally, midterm electorates have more high-propensity voters than presidential electorates, which should limit the impact of any such divergence this year. Going by 2017-2022, the D+10 special election environment would imply a D+7 to D+11 landslide, similar to what generic ballot polls and primary turnout indicate. By contrast, in 2024, the D+6 special election environment contrasted sharply with tied general election polls.
On its own, the specter of 2024 means that we cannot put too much weight on special elections. However, with special elections corroborating other predictors instead of contrasting with them, it seems much likelier than not that they point to the same blue wave.
WASHINGTON PRIMARY
The final predictor is one I wrote extensively on a couple weeks ago: the Washington primary. The piece has all the details, but TL;DR, the Washington top-two primary is very predictive of how Washington will vote. And usually, that correlates to how the rest of the nation votes.
This year, Democrats won the Washington primary vote by ~27%, a whopping 10% bluer than 2024. According to the historical pattern, a blue tsunami is going to hit Washington this year. However, whether the rest of the country follows suit is a different question. In 2018, 2020, and 2022, the swing in Washington roughly matched the national swing. In 2024 though, Washington had the smallest swing toward Trump of any state in the country. While the Washington primary very accurately predicted Washington, Washington failed to predict the country.
It is certainly possible that Washington is once again an outlier, swinging much bluer than the rest of the country. Still, the projected D+10 swing in Washington, if translated nationwide, would imply a ~D+9 year, well in line with generic ballot polls, primary turnout, and special elections. For Washington to be an outlier, almost every other predictor would have to be wrong.
OCCAM’S RAZOR
Perhaps all the data is wrong. Perhaps the generic ballot polls are overestimating Democrats again. Perhaps coalitions have shifted too much for primaries and special elections to be predictive. Perhaps Washington is once again a national outlier. Perhaps everything is wrong, and 2026 will be a reverse 2022.
Or perhaps – and far more likely – the conclusion that literally every predictor supports is correct: that 2026 is going to be a blue wave year.
When it comes to interpreting the data, it’s always good to harbor some skepticism, to consider other viewpoints, and to question your biases. After all, it was a failure to do exactly this that caused the fiasco in 2022. But sometimes, the data is just extremely clear, and analysts do their readers a disservice by avoiding what is obviously true.
Excellent analysis. There is a key differentiator this year: the environment is accelerating toward Democrats in an unprecedented manner, because fuel and food inflation is just beginning to be felt, as gas and diesel are up substantially in the past few weeks. Those correlate strongly to the generic ballot and if they continue on the current path, D+11 is at the low end of outcomes. We are likely to see $8-10 per gallon diesel at the pump by Election Day, and $6-7 gasoline, which would imply D+15-18 generic ballot, which is outside the band of elections you reviewed.
That is exactly what I want to hear and Will Happen.